Home Prices Down. Affordability Improves.

Vancouver, BC – October 15, 2008. British Columbia Real Estate Association (BCREA) reports residential sales dollar volume on the Multiple Listing Service (MLS) in BC declined 39 per cent to $2.1 billion in September, compared to September 2007. Residential unit sales were down 34 per cent to 5,107 units during the same period. The average MLS residential price in the province was $412,149, down 7 per cent from September 2007.

“Weaker consumer demand and a large number of homes for sale are having an impact on home prices in the province,” said Cameron Muir, BCREA Chief Economist. “Despite relatively strong fundamentals, consumer confidence is low.

The global liquidity crisis and volatile equity markets are intensifying this sentiment, causing many households to pull back spending on major purchases.”

“However, affordability is improving,” added Muir. “The carrying cost of the average home in the province is now lower than at any time since the end of 2006.”

Year-to-date MLS residential sales dollar volume in the province declined 24 per cent to $27.5 billion compared to the same period last year. Provincial MLS sales declined 28 per cent to 59,742 units, while the average residential price increased 6 per cent to $460,621 over the same period.

Full story and graphs in the pdf link below.

home-prices-down-affordability-improves-british-columbia-real-estate-association

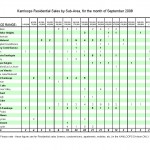
Kamloops MLS Residential Sales by Sub-Area, for the month of September 2008

Here is the latest Kamloops MLS Residential Sales by Sub-Area, for the month of September 2008. Published by the Kamloops and District Real Estate Association. This chart will help you see how many residential properties have sold in a given neighbourhood and the price range it sold in. The type of property is not displayed in this chart. Look at the Kamloops Real Estate, Comparative Analysis by Property Type for September, 2008 post found here: Link

kamloops-residential-mls-sales-by-sub-area-for-the-month-of-september-2008-pdf

Kamloops Residential MLS Sales by Sub-Area, for the month of September 2008

Kamloops Residential MLS Sales by Sub-Area, for the month of September 2008

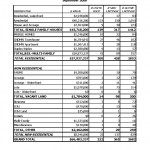
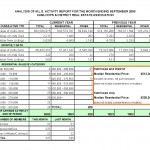
Kamloops Real Estate, Comparative Analysis by Property Type, September, 2008.

Here is the latest Kamloops Real Estate, Comparative Analysis by Property Type for September, 2008. Supplied by the Kamloops & District Real Estate Association. With this chart you can get an idea of what property types are: Active listings, newly listed, # of units sold and the value of those units. These totals are down a bit from last month.

A quick summary for total residential active, new and sold listing for September 2008 for Kamloops and surrounding areas:

Residential # of active listings 1853
Residential # of new listings 428
Residential # of sold listings 200
Value of sold units $57,937,337

kamloops-comparative-analysis-by-property-type-september-2008 pdf

Kamloops Real Estate MLS Listings Comparative Analysis by Property Type, September, 2008

Kamloops Real Estate MLS Listings Comparative Analysis by Property Type, September, 2008

1 103 104 105 106