Kamloops and District Real Estate Association Statistics For February 2009

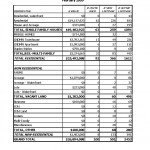
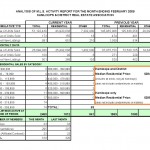
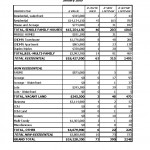
The February 2009 Kamloops and district real estate statistics are out. No surprise that home sales are down. The median price for homes in the Kamloops city area is down by $50,000 and the median home price for homes in all of the Kamloops district is down by $28,500. Keep in mind that the median home price can be affected by high price property sales.

kamloops-real-estate-comparative-analysis-by-property-type-february-2009

Kamloops Real Estate Comparative Analysis By Property Type February 2009

kamloops-real-estate-mls-activity-february-2009

Kamloops Real Estate MLS Activity February 2009

B.C. Real Estate Association Market At A Glance

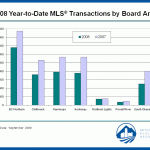
Kamloops Real Estate: 2008 YTD MLS Transactions by Board (small boards) Here are some charts that the B.C. Real Estate Association has released. I personally find it helpful to see statistics as an image or chart, sometimes just numbers are not enough. The first chart is a comparison of all the smaller boards throughout B.C.  Kamloops is one of the mid-sized boards among the smaller markets. As you will see in this chart, the Kootenays, Kamloops and Chilliwack appear to be very similar in the amount of activity for MLS listing sales. You can click on the image to enlarge it.
 

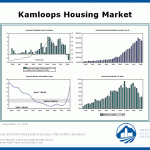
Kamloops Real Estate: Housing Market MLS Listing ActivityThis next set of 4 graphs shows the direction of the market. From left to right the graphs read Kamloops Residential Market Conditions, Kamloops Quarterly Residential Price, Kamloops Months of Residential Supply and finally bottom right Kamloops Residential Unit Sales. It is interesting to see the sales to active listings ratio in the first graph and how the lines flipped to the downside suddenly. I think that this flip took a lot of people by surprise. The bottom left chart shows the strong buyers market that we are in and how it shot up mid to late 2008.
 

Kamloops and District Real Estate Association Statistics For January 2009

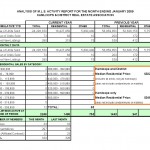
The numbers are out. The Kamloops and District Real Estate Association has released the statistics for January 2009. It is amazing to see the difference between the number of sales this January vs. the number of sales last January. I thought the numbers would be up significantly from December 2008, but I was definitely wrong (December there were 60 residential sales). Residential unit sales were up by only three for the past month. I have noticed an increase in the amount of buyers actively looking for a home, but obviously many buyers are waiting to see what will happen with the prices in the market in the next couple months or so. I will be interested to see the February statistics and see if there is a significant change from January, which I believe should occur.

Kamloops Real Estate, Comparative Analysis By Property Type For January 2009.

Kamloops Real Estate Comparative Analysis By Property Type January 2009

Kamloops Real Estate Comparative Analysis By Property Type January 2009

Kamloops Real Estate, MLS Activity Report For January 2009.

Kamloops Real Estate, MLS Activity Report January 2009

Kamloops Real Estate, MLS Activity Report January 2009

5th Annual Demographia International Housing Affordability Survey 2009

The Demographia 5th Annual International Housing Affordability Survey for 2009 is out. It rates metropolitan markets for affordability of the housing in each market. Australia, Canada, Ireland, New Zealand, the United Kingdom and the United States are all discussed.

The Demographia International Housing Affordability Survey employs the “Median House Price to Median Household Income Multiple,” (“Median Multiple”) to rate housing affordability. The ratings are as follows 3.0 or Less is defined as “Affordable”, 3.1 to 4.0 “Moderately Unaffordable”, 4.1 to 5.0 “Seriously Unaffordable” and 5.1 and above “Severely Unaffordable”.

In recent decades, the Median Multiple has been remarkably similar among the nations surveyed, with median house prices being generally 3.0 or less times median household incomes. This historic affordability relationship continues in many housing markets of the United States and Canada. However, the Median Multiple has escalated sharply in Australia, Ireland, New Zealand and the United Kingdom and in some markets of Canada and the United States.

Over the past year, house prices have declined in most markets. This “bursting of the housing bubble” followed an unprecedented increase in housing prices in all markets except some areas in the United States and Canada. The result is that housing affordability has generally improved, though remains at Median Multiples well above the historic norm in many markets.

Vancouver came in at 8.4, Victora 7.4, Kelowna 6.8 and Abbotsford 6.5 to name a few. All the previously named markets are defined as “Severely Unaffordable”. The province of British Columbia was generally described as severely unaffordable based on the calculations employed in this survey. However, many of these severely unaffordable markets have experienced steep price declines in the last year. Among the major markets, Vancouver is the least affordable. The Kamloops market was not specifically cited in this survey, but as a part of the province of British Columbia one can draw the conclusion that we too are at least “seriously unaffordable”.

To read the entire PDF document from The Demographia Survey click HERE.

1 101 102 103 104 105 106